Module 4.1 Demonstration
Tidy & Manipulate: Part I - Tidy
Recall
Now that you have imported your data and you understand the basics of managing your data structure.
The next thing you probably want to do is jump into exploratory data analysis (i.e. basic descriptive statistics or data visualizations).
However, prior to that, it is important to make sure your data frame is properly prepared for analysis.
This may require you to do some basic manipulation and ensure your data is in a "tidy" format.
%>% (Pipe) Operator
The
tidyrpackage makes use of the pipe operator%>%developed by Stefan Milton Bache in the R package magrittr.Operator
%>%moves or "pipes" the result forward into the next function call/expression.f(x) is the same as x %>% f()
- For instance, regular code chunks work from inside out:
finally_last_step( and_then_third( then_second( do_first(data) ) ))- Piping uses intuitive ordering:
data %>% do_first() %>% then_second() %>% and_then_third() %>% finally_last_step()What is Tidy data?
Each variable must have its own column.
Each observation must have its own row.
Each value must have its own cell.
Why Tidy data ?
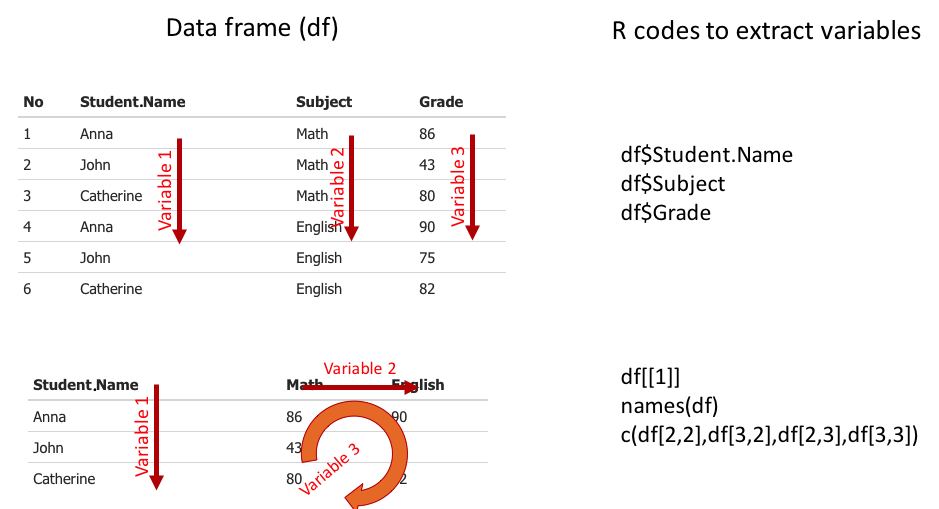
- Placing variables in columns takes advantage of R's vectorized nature. One can extract variables in a simple, standard way.
Why Tidy data ?
Placing variables in columns takes advantage of R's vectorized nature. One can extract variables in a simple, standard way.
Have a look at the following illustration. Which would you rather work with?
Why Tidy data ?
Placing variables in columns takes advantage of R's vectorized nature. One can extract variables in a simple, standard way.
Have a look at the following illustration. Which would you rather work with?

Provides a standard and consistent way of storing data that makes transformation, visualization, and modeling easier.
Activity1. States of the United States of America
- The following data frame includes some characteristics of 50 states of the United States of America for 1977.
## Population Income Illiteracy Life Exp Murder HS Grad Frost## Alabama 3615 3624 2.1 69.05 15.1 41.3 20## Alaska 365 6315 1.5 69.31 11.3 66.7 152## Arizona 2212 4530 1.8 70.55 7.8 58.1 15## Arkansas 2110 3378 1.9 70.66 10.1 39.9 65## California 21198 5114 1.1 71.71 10.3 62.6 20## Colorado 2541 4884 0.7 72.06 6.8 63.9 166## Connecticut 3100 5348 1.1 72.48 3.1 56.0 139## Delaware 579 4809 0.9 70.06 6.2 54.6 103- Is this Tidy? Press P to get the answer!
Population: population Income: per capita income Illiteracy: illiteracy (percent of the population) Life Exp: life expectancy in years Murder: murder and non-negligent manslaughter rate per 100,000 population HS Grad: percent high-school graduates Frost: mean number of days with minimum temperature below freezing Area: land area in square miles
Tidy as one variable per column and one observation per row. This way, we can take the required variable/column using $ or [ ] very easily using df$Life_Exp and calculate its mean using mean(df$Life_Exp).
Activity2. Province population in Canada
- The following data frame includes province population in different provinces of Canada.
## source destination migrants distance pops66 pops71 popd66 popd71## 1 PEI NFLD 255 924 108535 111641 493396 522104## 2 NS NFLD 2380 952 756039 788960 493396 522104## 3 NB NFLD 1140 1119 616788 534557 493396 522104## 4 QUE NFLD 2145 1641 5780845 6027764 493396 522104## 5 ONT NFLD 6295 1996 6960870 7703106 493396 522104## 6 MAN NFLD 215 3159 963066 988247 493396 522104## 7 SASK NFLD 185 3542 955344 926242 493396 522104## 8 ALTA NFLD 425 4059 1463203 1627874 493396 522104## 9 BC NFLD 425 4838 1873674 2184621 493396 522104## 10 NFLD PEI 340 924 493396 522104 108535 111641- Is this data Tidy? Press P to get the answer!
source: Province of Canada pops66: 1966 population of source province. pops71: 1971 population of source province.
Untidy as two variables given in columns (population 1966 and 1971) are not variables but values of another variable.
Activity3. WHO TB rates
- The following data frame includes Tuberculosis rates (TB) of different countries:
## # A tibble: 6 × 3## country year rate ## <chr> <dbl> <chr> ## 1 Afghanistan 1999 745/19987071 ## 2 Afghanistan 2000 2666/20595360 ## 3 Brazil 1999 37737/172006362 ## 4 Brazil 2000 80488/174504898 ## 5 China 1999 212258/1272915272## 6 China 2000 213766/1280428583- Is this data Tidy? Press P to get the answer!
country: country name year: year rate: TB rate given in (cases/population)
Untidy. Tuberculosis rates (TB) cannot be evaluated in this format. TB rate column consists of two variables namely: TB cases and population.
Tidy data Cont.
The principles of tidy data might seem so obvious that you wonder if you’ll ever encounter a data set that isn’t tidy. Unfortunately, however, most real data is untidy. There are two main reasons:
Data is often organized to facilitate some goal other than analysis. For example, it’s common for data to be structured to make data entry, not analysis, easy.
Most people aren’t familiar with the principles of tidy data, and it’s hard to derive them yourself unless you spend a lot of time working with data.
Long vs. wide format data
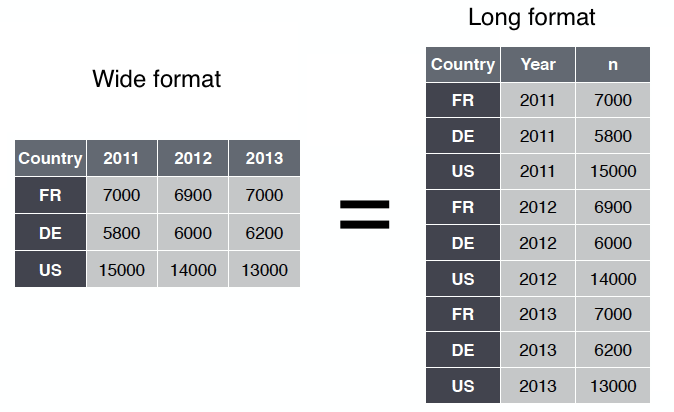
A single data set can be rearranged in many different ways.
One of the ways is called "long format". In this layout, the data set is arranged in such a way that a single subject's information is stored in multiple rows.
In the wide format, a single subject's information is stored in multiple columns.
The main difference between a wide layout and a long layout is that the wide layout contains all the measured information in different columns.
Long vs. wide & tidy data
Tidy data is typically in a long format:
Tidy data follows the rules of long format: each variable is a column, and each observation is a row.
Long format is the most common format used in tidy data.
Wide format is often used for summarizing or comparing data but is not as suitable for analysis and is not considered tidy data.
The tidyr package
tidyris a one such package which was built for the sole purpose of simplifying the process of creating tidy data.There are four fundamental functions of data tidying that
tidyrprovides:
pivot_longer()ORgather()makes "wide" data longer.pivot_wider()ORspread()makes "long" data wider.separate()splits a single column into multiple columns.unite()combines multiple columns into a single column.
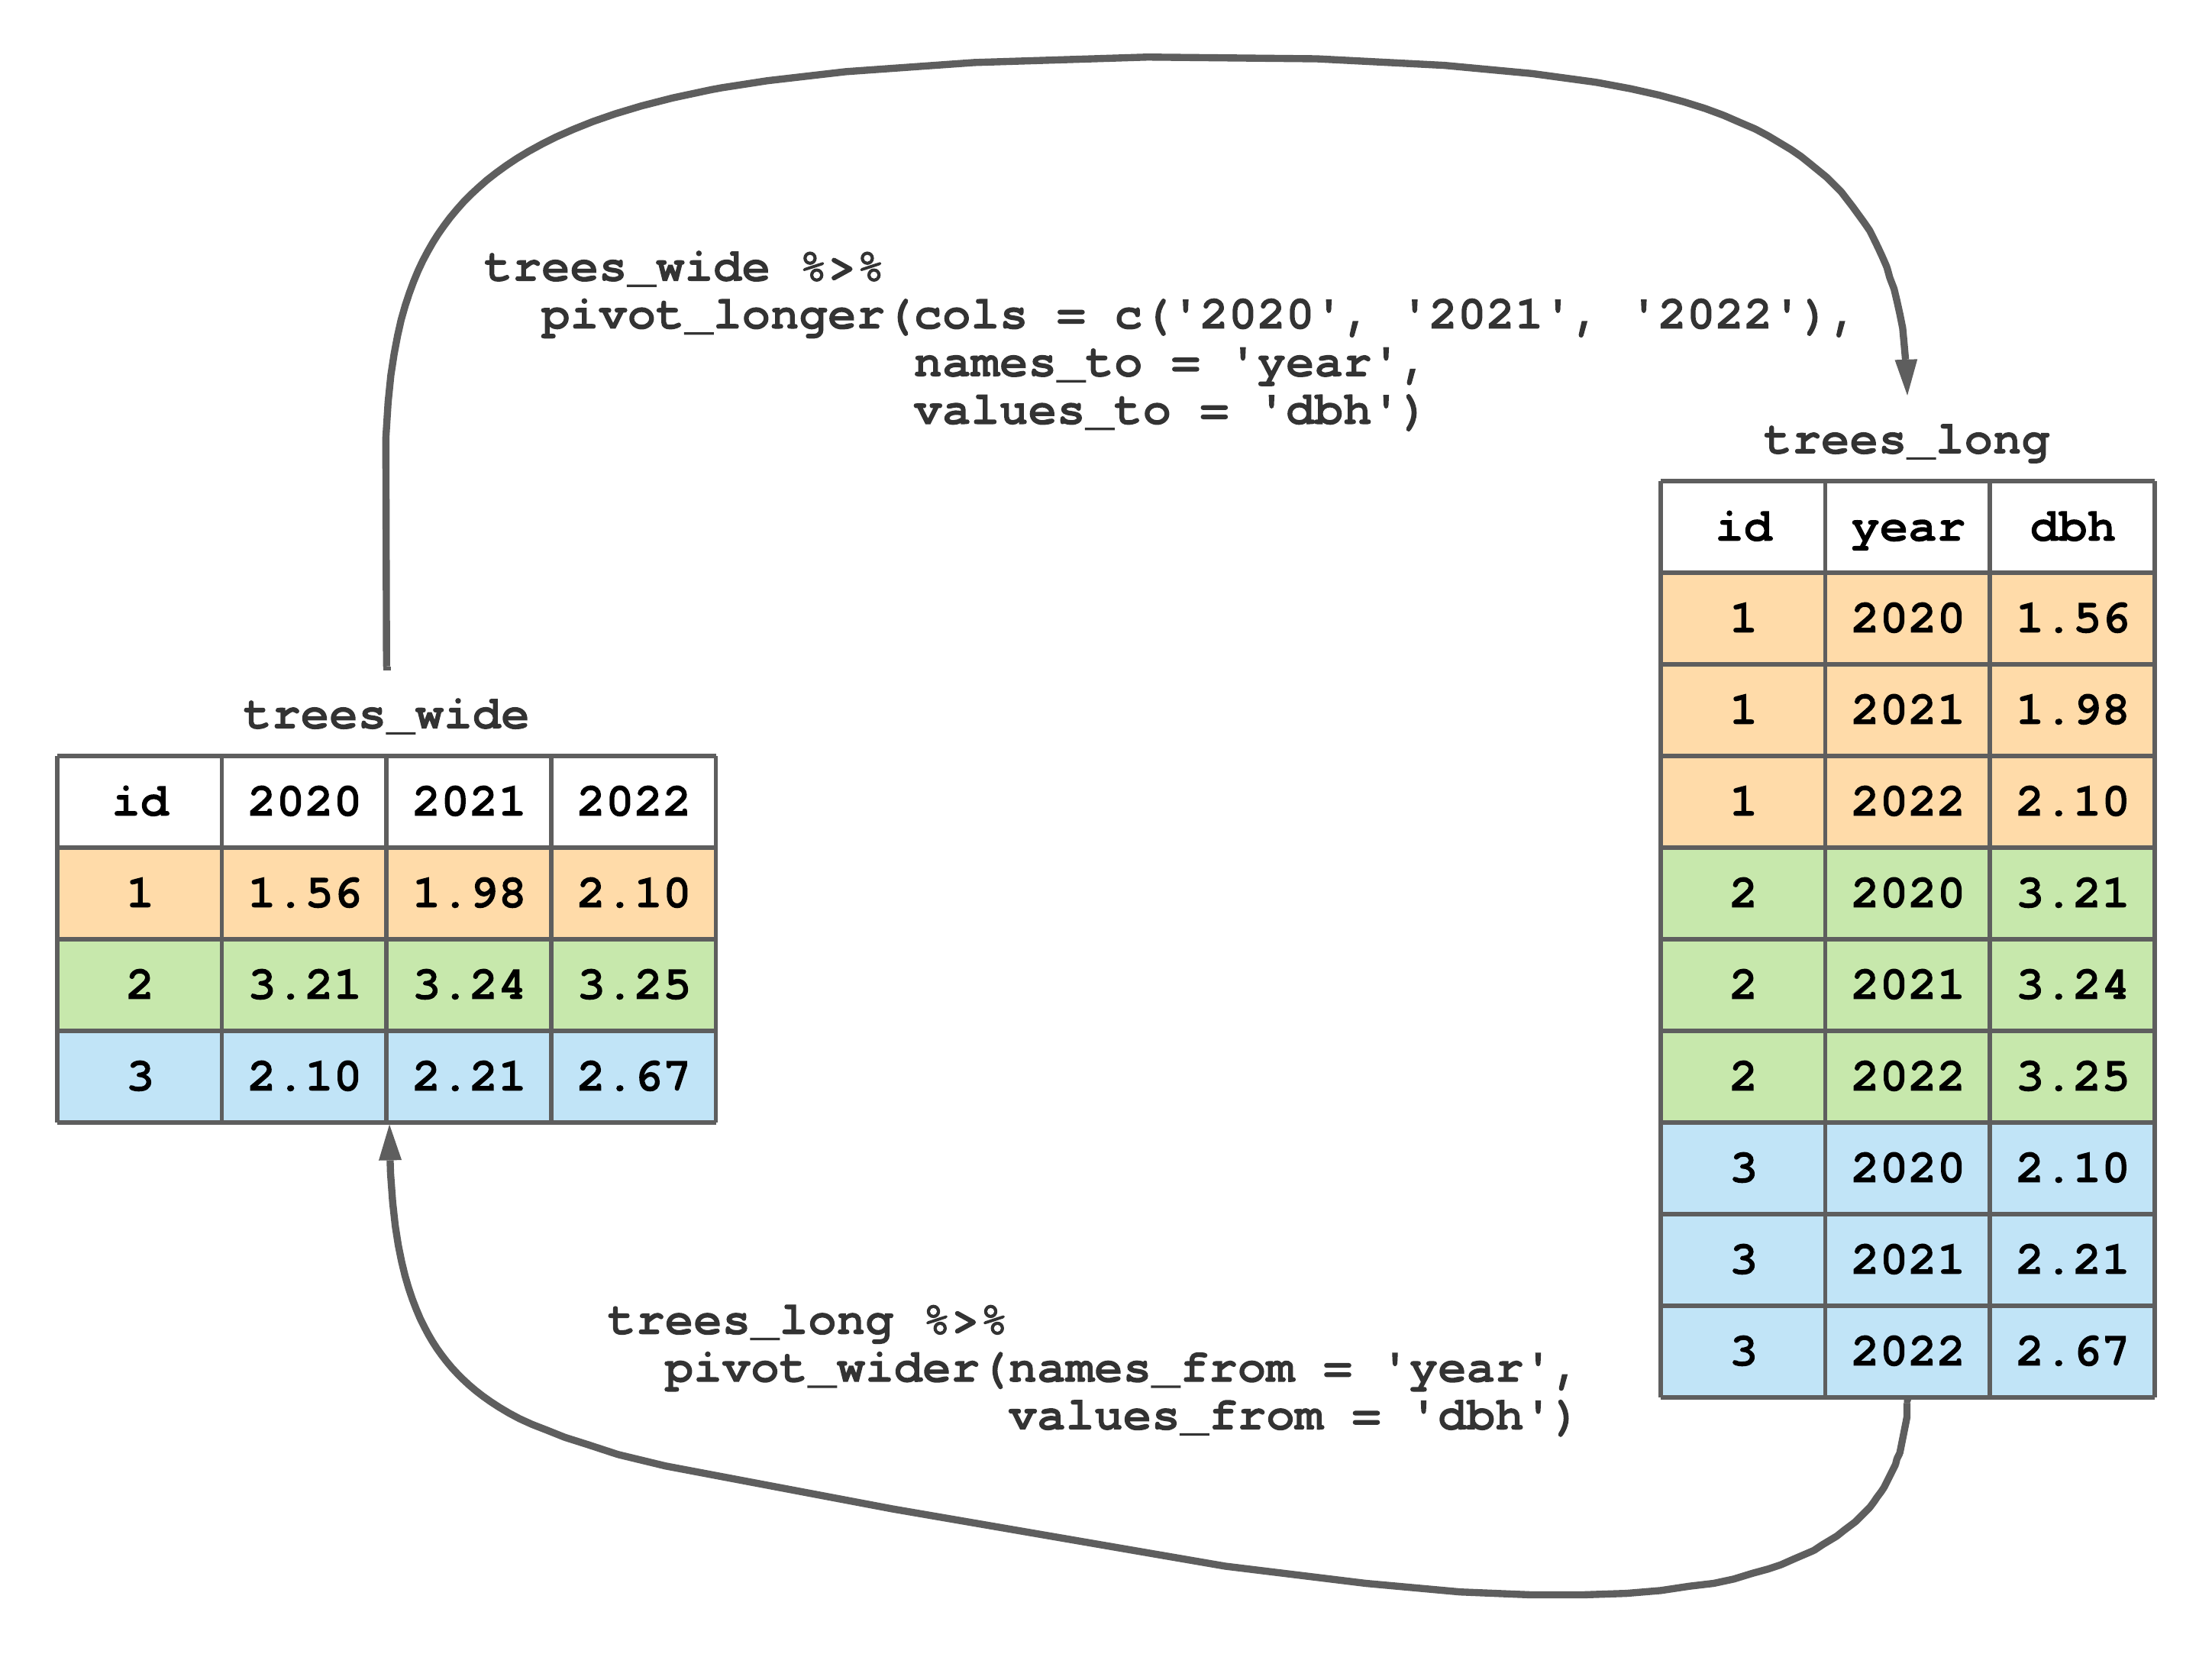
pivot_longer() (gather()) function
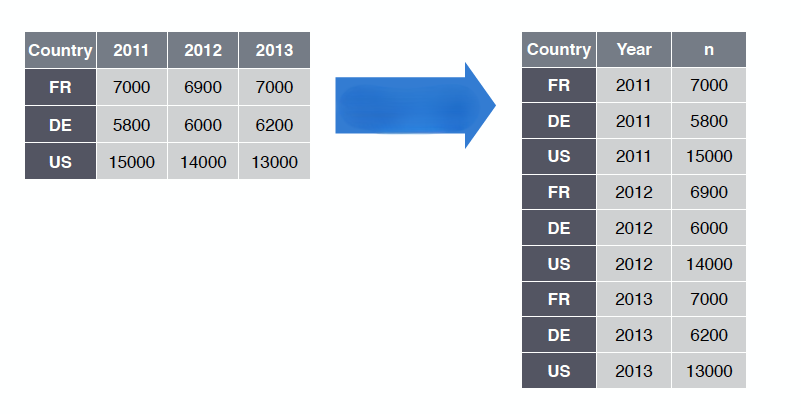
Objective: Reshaping wide format to long format.
pivot_longer() function arguments
Function: pivot_longer(data, names_to = " ", values_to = " ", cols = )Arguments: data: data frame names_to: name of the column to create from the data stored in the column names of data values_to: name of the column to create from the data stored in cell values cols: columns that should be pivot into longer format.gather() function arguments
Function: gather(data, key, value,...)Arguments: data: data frame key: column name representing new variable value: column name representing variable values ...: names of columns to gather (or not gather)gather() function
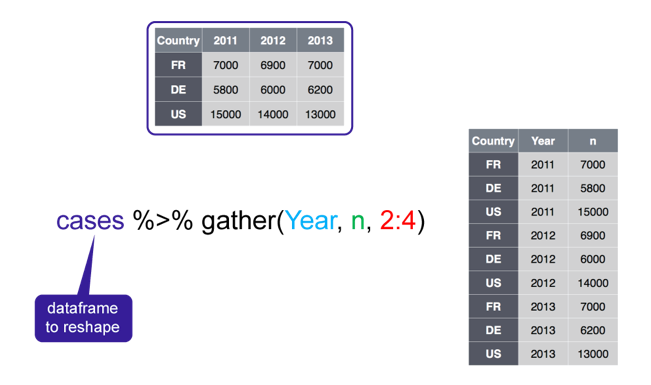
gather() function
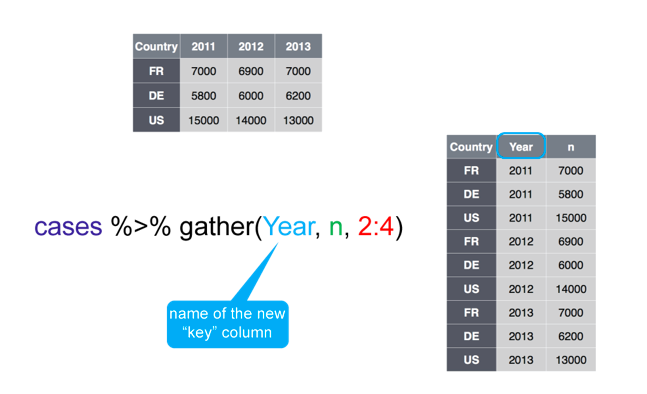
gather() function
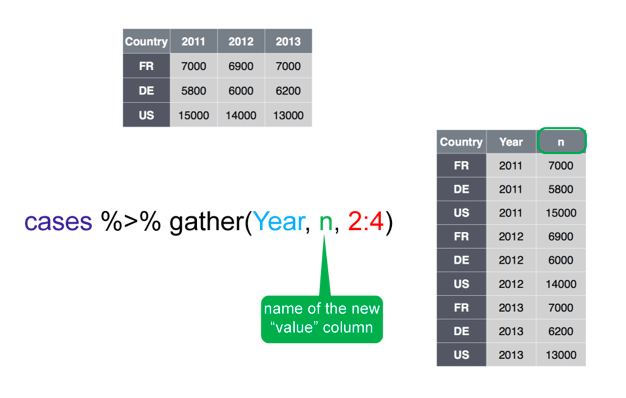
gather() function
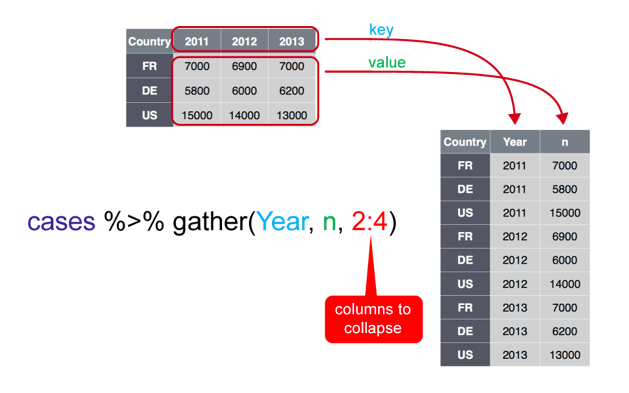
Example
Consider the following data set:
## Group Year Qtr.1 Qtr.2 Qtr.3 Qtr.4## 1 1 2006 15 16 19 17## 2 1 2007 12 13 27 23## 3 1 2008 22 22 24 20## 4 1 2009 10 14 20 16## 5 2 2006 12 13 25 18## 6 2 2007 16 14 21 19## 7 2 2008 13 11 29 15## 8 2 2009 23 20 26 20## 9 3 2006 11 12 22 16## 10 3 2007 13 11 27 21## 11 3 2008 17 12 23 19## 12 3 2009 14 9 31 24- Wide or long format data ?
Example
Consider the following data set:
## Group Year Qtr.1 Qtr.2 Qtr.3 Qtr.4## 1 1 2006 15 16 19 17## 2 1 2007 12 13 27 23## 3 1 2008 22 22 24 20## 4 1 2009 10 14 20 16## 5 2 2006 12 13 25 18## 6 2 2007 16 14 21 19## 7 2 2008 13 11 29 15## 8 2 2009 23 20 26 20## 9 3 2006 11 12 22 16## 10 3 2007 13 11 27 21## 11 3 2008 17 12 23 19## 12 3 2009 14 9 31 24Wide or long format data ?
This data is considered wide since the time variable (represented as quarters) is structured such that each quarter represents a variable.
Example Cont.
- We need to gather each quarter within one column/variable and also gather values associated with each quarter in a second column.
# long_DF <- DF %>% gather(Quarter, Revenue, Qtr.1:Qtr.4) long_DF <- DF %>% pivot_longer(cols = Qtr.1:Qtr.4,names_to = "Quarter",values_to = "Revenue")head(long_DF, 24) # note, for brevity, I only show the data for the first two years ## Group Year Quarter Revenue## 1 1 2006 Qtr.1 15## 2 1 2007 Qtr.1 12## 3 1 2008 Qtr.1 22## 4 1 2009 Qtr.1 10## 5 2 2006 Qtr.1 12## 6 2 2007 Qtr.1 16## 7 2 2008 Qtr.1 13## 8 2 2009 Qtr.1 23## 9 3 2006 Qtr.1 11## 10 3 2007 Qtr.1 13## .. ... ... ... ...Example Cont.
## Group Year Qtr.1 Qtr.2 Qtr.3 Qtr.4## 1 1 2006 15 16 19 17## 2 1 2007 12 13 27 23## 3 1 2008 22 22 24 20......- Note that all of these produce the same result:
DF %>% pivot_longer(cols = Qtr.1:Qtr.4,names_to = "Quarter",values_to = "Revenue")DF %>%pivot_longer(cols = -c(Group, Year),names_to = "Quarter",values_to = "Revenue")DF %>% pivot_longer(cols = 3:6,names_to = "Quarter",values_to = "Revenue")DF %>% pivot_longer(cols = c(Qtr.1, Qtr.2, Qtr.3, Qtr.4),names_to = "Quarter",values_to = "Revenue")pivot_wider() (spread()) function
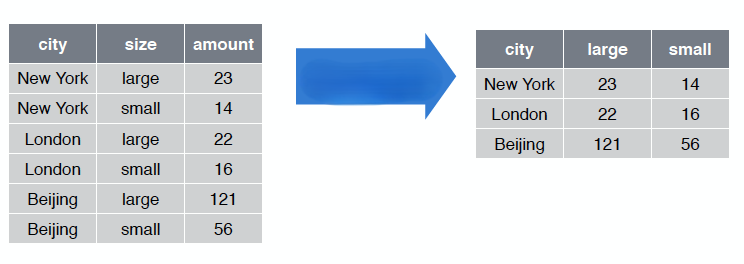
Objective: Reshaping long format to wide format.
- This function is a complement to
pivot_wider()/spread().
pivot_wider() function arguments
There are times when we are required to turn long formatted data into wide formatted data.
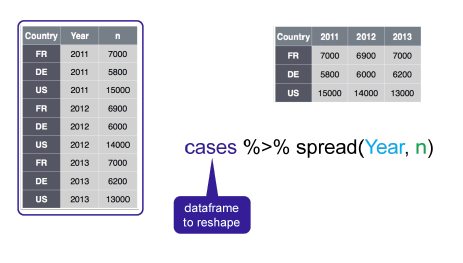
When multiple variables are stored in rows, the
pivot_wider()function generates columns from rows. This function spreads a key-value pair across multiple columns.
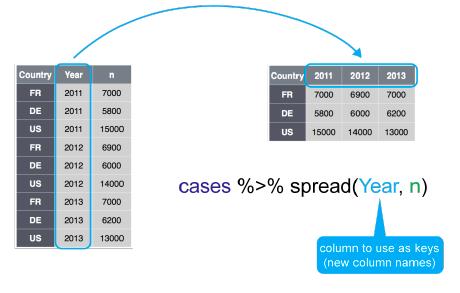
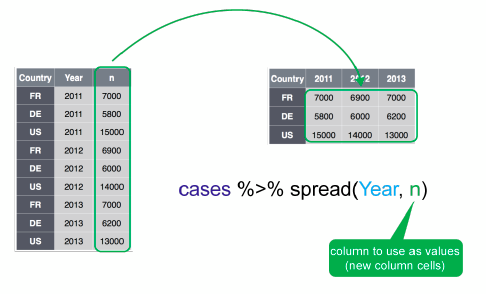
Function: pivot_wider(data, names_from = " ", values_from = " ")Arguments: data: data frame names_from: column that contains variable names values_from: column that contains values from multiple variablesspread() function arguments
Function: spread(data, key, value)Arguments: data: data frame key: column values to convert to multiple columns value: single column values to convert to multiple columns' valuesspread() function
spread() function
spread() function
Example
## # A tibble: 12 × 4## country year type count## <chr> <dbl> <chr> <dbl>## 1 Afghanistan 1999 cases 745## 2 Afghanistan 1999 population 19987071## 3 Afghanistan 2000 cases 2666## 4 Afghanistan 2000 population 20595360## 5 Brazil 1999 cases 37737## 6 Brazil 1999 population 172006362## 7 Brazil 2000 cases 80488## 8 Brazil 2000 population 174504898## 9 China 1999 cases 212258## 10 China 1999 population 1272915272## 11 China 2000 cases 213766## 12 China 2000 population 1280428583Suppose you want to calculate tuberculosis rate from (rate = cases/population).
To achieve this,
casesandpopulationneeds to be separately given in columns.
Example Cont.
#spread(table2, key = type, value = count)pivot_wider(table2,names_from = type,values_from = count)## # A tibble: 6 × 4## country year cases population## <chr> <dbl> <dbl> <dbl>## 1 Afghanistan 1999 745 19987071## 2 Afghanistan 2000 2666 20595360## 3 Brazil 1999 37737 172006362## 4 Brazil 2000 80488 174504898## 5 China 1999 212258 1272915272## 6 China 2000 213766 1280428583separate( ) function
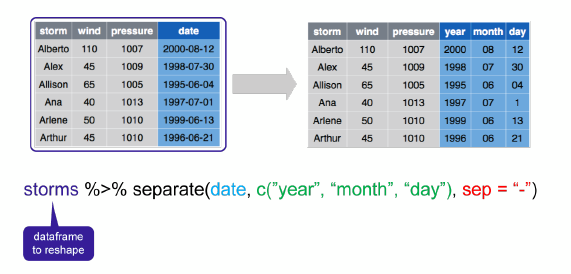
Objective: Splitting a single variable into two.
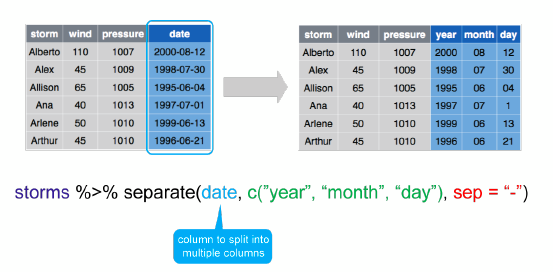
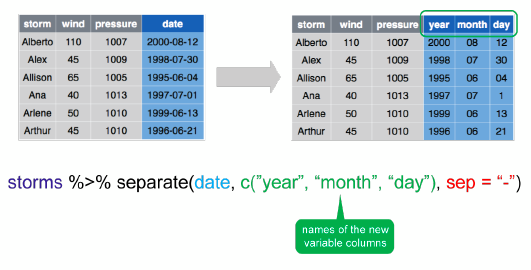
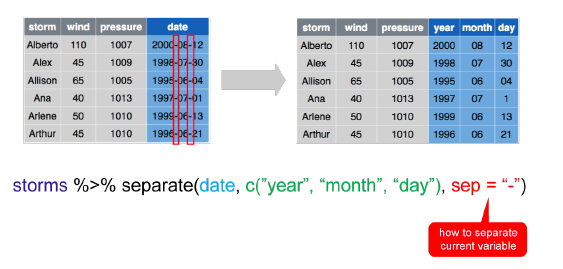
Many times multiple variables are stored in one column and you want to split them according to a separator character.
Function: separate(data, col, into, sep = " ", remove = TRUE, convert = FALSE)Same as: data %>% separate(col, into, sep = " ", remove = TRUE, convert = FALSE)Arguments: data: data frame col: column name representing current variable into: names of variables representing new variables sep: how to separate current variable (char, num, or symbol) remove: if TRUE, remove input column from output data frame convert: if TRUE will automatically convert values to logical, integer, numeric, complex or factor as appropriateseparate( ) function
separate( ) function
separate( ) function
separate( ) function
Example seperate() function
## # A tibble: 6 × 3## country year rate ## <chr> <dbl> <chr> ## 1 Afghanistan 1999 745/19987071 ## 2 Afghanistan 2000 2666/20595360 ## 3 Brazil 1999 37737/172006362 ## 4 Brazil 2000 80488/174504898 ## 5 China 1999 212258/1272915272## 6 China 2000 213766/1280428583- The rate column contains both cases and population variables, and we need to split it into two variables.
table3 %>%separate(rate, into = c("cases", "population"), sep = "/")## # A tibble: 6 × 4## country year cases population## <chr> <dbl> <chr> <chr> ## 1 Afghanistan 1999 745 19987071 ## 2 Afghanistan 2000 2666 20595360 ## 3 Brazil 1999 37737 172006362 ## 4 Brazil 2000 80488 174504898 ## 5 China 1999 212258 1272915272## 6 China 2000 213766 1280428583unite( ) function
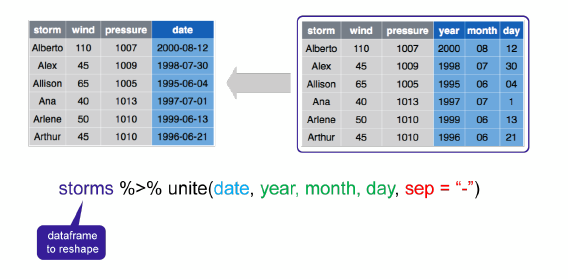
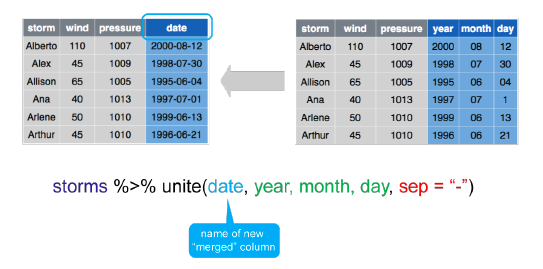
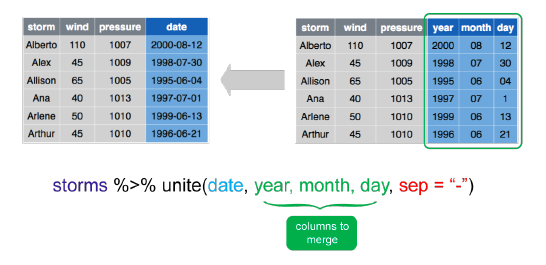
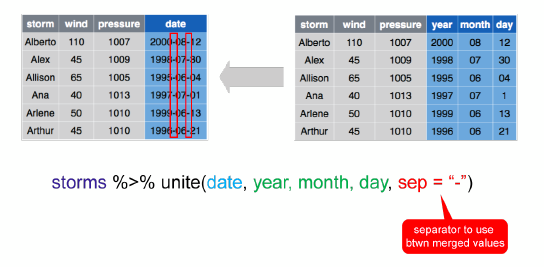
Objective: Merging two variables into one.
There may be a time in which we would like to combine the values of two variables. The unite() function combine multiple columns into a single column.
Function: unite(data, col, ..., sep = " ", remove = TRUE)Same as: data %>% unite(col, ..., sep = " ", remove = TRUE)Arguments: data: data frame col: column name of new "merged" column ...: names of columns to merge sep: separator to use between merged values remove: if TRUE, remove input column from output data frameunite( ) function
unite( ) function
unite( ) function
unite( ) function
Example unite() function
## # A tibble: 5 × 4## country century year rate ## <chr> <chr> <chr> <chr> ## 1 Afghanistan 19 99 745/19987071 ## 2 Afghanistan 20 00 2666/20595360 ## 3 Brazil 19 99 37737/172006362 ## 4 Brazil 20 00 80488/174504898 ## 5 China 19 99 212258/1272915272- Assume that we want to combine the
centuryandyearvariables into one variable callednew_year.
table5 %>%unite(new_year, century, year, sep="")## # A tibble: 6 × 3## country new_year rate ## <chr> <chr> <chr> ## 1 Afghanistan 1999 745/19987071 ## 2 Afghanistan 2000 2666/20595360 ## 3 Brazil 1999 37737/172006362 ## 4 Brazil 2000 80488/174504898 ## 5 China 1999 212258/1272915272## 6 China 2000 213766/1280428583What do you need to know by Week 4
Distinguish tidy vs untidy data sets.
Distinguish wide vs long format data.
Understand tidy data principles.
Use
tidyrpackage functions.
- Practice!
Worksheet questions:

- Complete the following worksheet:
- Once completed, feel free to work on your Assessments.

